Class: ARC387
Instructor: Fadi Masoud
Fall 2020
Noel Sampson
1004911508
November 18th, 2020
ARC386
1004911508
November 18th, 2020
ARC386
Annotated Bibliography
St. John's and It's Vulnerabilities to Climate Change
Past:
1.)
Hetzinger, S., J. Halfar, T. Zack, J. V. Mecking, B. E. Kunz, D. E. Jacob, and W. H. Adey. “Coralline Algal Barium as Indicator for 20th Century Northwestern North Atlantic Surface Ocean Freshwater Variability,” May 2, 2013.
https://www.nature.com/articles/srep01761
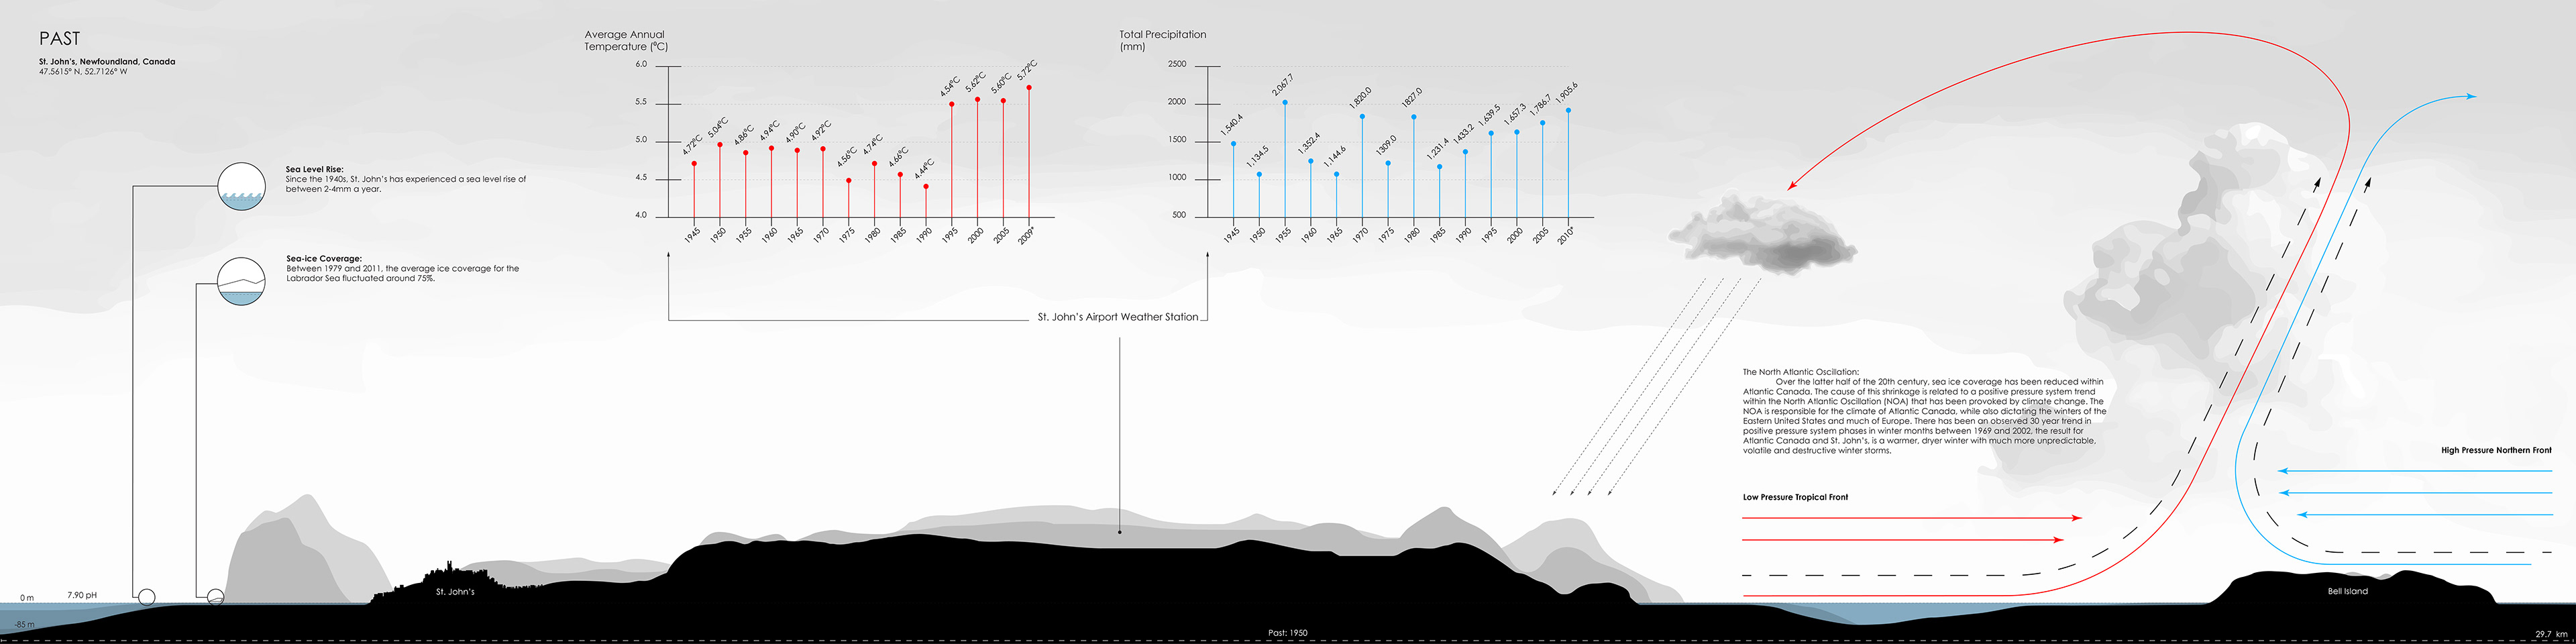
This report is the first multi-decadal record of annually resolved Ba/Ca variations in the Northwest Atlantic coralline algae, specifically along the Newfoundland coastline. This long term study documents how certain events, episode and elemental levels have changed over the latter half of the decade because of climate change, and demonstrates how Algal Ba/Ca ratios can serve as a vital resource in understanding and documenting fluctuations and trends in sea surface salinity and ocean freshwater. Large amounts of fresh water have been added to the North Atlantic as ice reserves in the North Pole and Greenland begin to melt. This report describes that this phenomenon is following a similar trend to the amplification of the North Atlantic Oscillation and increasing global temperatures, that have in turn resulted in an increased frequency of polar pulses. The effects of freshening events caused by polar pulses vary depending on the length and amount of water released. Within the Labrador Sea, freshening events decrease sea surface salinity levels and result in high levels of sea ice in the winter months. This report makes it evident that such changes have had a detrimental impact on the coastal waters around Newfoundland and Labrador, with a specific impact on the transportation of ice within the Labrador Current. A current that has historically provided a net cooling effect for both air and coastal water temperatures, is now seeing a warming trend.
2.)
Johnston, D. W., A. S. Friedlaender, L. G. Torres, and D. M. Lavigne. "Variation in Sea Ice Cover on the East Coast of Canada from 1969 to 2002: Climate Variability and Implications for Harp and Hooded Seals." Climate Research 29, no. 3 (2005): 209-22. Accessed November 3, 2020. http://www.jstor.org/stable/24868805.
https://www-jstor-org.myaccess.library.utoronto.ca/stable/24868805?seq=1#metadata_info_tab_contents
This article provided an analysis of the effects of climate change in regards to impacts on sea ice cover over the latter half of the 20th century by providing an in depth study on seal populations within Atlantic Canada. The reproductive success of pagophilic seals on sea ice is directly dependent, with less ice resulting in a smaller habitat which then has a detrimental impact on the mortality rate of seal pups. The article explains that the cause of this shrinkage in ice cover is directly related to the nature of positive pressure system trend within the North Atlantic Oscillation (NOA). The article makes it evident that the NOA is responsible for the climate of Atlantic Canada while also dictating the winters of the Eastern United States and much of Europe. With a roughly 30 year trend, between 1969 and 2002, leading the NOA into a cycle of more prominent positive pressure phases in winter months the results have led to warmer winters in the subtropics that generate stronger winter storms and push them on a north-westerly track directed towards the north-eastern United States and Atlantic Canada. The effects on St. Johns and Newfoundland are described as milder dry winters but with much more sporadic and destructive winter storms.
3.)
“St. John's Airport Weather Station Annual Climate Data.” Community Accounts: Climate Data. Accessed November 12, 2020. https://nl.communityaccounts.ca/climate/yearly_multi.asp?_=jYGUW1RPt6Z8lXlYVmidkGg_
This document served as an account for temperature and precipitation data for the 20th century. It synthesizes data from the Environment and Natural Resources Canada, with on site analytics collected from the St. John’s Airport. In regards to temperature the document made it apparent that annual temperatures have fluctuated greatly in the City since documentation began in 1942. St. John's hit high periods were the average annual temperature periods exceeded 5.0⁰C in the early 1950s and the late 1960s, after which the average temperatures dropped to a period that fluctuated around 4.5⁰C and as low as 4.14⁰C in both 1991 and 1993, but by 1997 temperatures once again surpassed the yearly average of 5.0⁰C and this time they have stayed above following on upwards trend. This report made it evident that annual totals in precipitation for the City have remained relatively stable, fluctuating around 1500mm with the occasional dry year that delivers between 1000mm and 1200mm of precipitation. The trend has followed a slight upwards trend since 1942, and since the 1980s the fluctuations in averages have become much more sporadic, but we are seeing a trend positioned in the 1500mm to 2000mm range.
4.)
Richter, Kristin, Jan Even Øie Nilsen, Roshin P. Raj, Ingo Bethke, Johnny A. Johannessen, Aimée B. A. Slangen, and Ben Marzeion. "Northern North Atlantic Sea Level in CMIP5 Climate Models: Evaluation of Mean State, Variability, and Trends against Altimetric Observations." Journal of Climate 30, no. 23 (2017): 9383-398. Accessed November 3, 2020. doi:10.2307/26388724.
https://www-jstor-org.myaccess.library.utoronto.ca/stable/26388724?Search=yes&resultItemClick=true&searchText=north+atlantic+sea+level+rise&searchUri=%2Faction%2FdoBasicSearch%3FQuery%3Dnorth%2Batlantic%2Bsea%2Blevel%2Brise&ab_segments=0%2Fbasic_search_solr_cloud%2Fcontrol&refreqid=fastly-default%3A45cfac616faeed6f3d17fe32ec90ba5b&seq=1#metadata_info_tab_contents
This data packed article provided an impact assessment on land-ice melting and trends in sea level rise over a 20 year period within the North Atlantic and Labrador Sea. It made it clear that the regional wide trend, in its current form, is seeing an average increase of 1.75 mm per year. Within the entirety of the North Atlantic, altimetry satellite studies between 1993 and 2012, indicate that the region of the Labrador Sea finds itself on the more aggressive end of the spectrum. The Labrador Sea is seeing observable change in sea level rise that is increasing at a rate that is exceeding 2mm a year. This article also focuses on the source of this rise, that being the melting of the polar ice caps, and trends in glacial ice melt. The rest of the article is then a series of data sets, acronyms, graphs and dense text that attempted to reduce a vast array of trends and phenomena into a single linear trend that could describe a sort of universal North Atlantic mean state in regards to sea level rise.
5.) Rep. Canada's State of the Oceans Report, 2012. Ottawa, Ontario: Communications Branch Fisheries and Oceans Canada, 2012.
https://www.dfo-mpo.gc.ca/oceans/publications/soto-rceo/2012/page03-eng.html
This report provided me with an in-depth understanding of the effects of hypoxic conditions and how warming currents are going to affect aquatic life throughout Canadian Oceans. Within the Atlantic region, hypoxia is well underway. In locations such as the Gulf of St. Lawrence, this page makes it evident that in deeper waters a significant reduction has been made to saturation levels since 1932 when levels were first recorded. In 1932, the recorded figure for oxygen saturation stood at a healthy 38%, by comparison, just some 50 years later, levels in the same location had been reduced to just 20% by the mid 1980s. The report explains that the main cause of this reduction is due to a temperature spike in deep water currents. As warm water is unable to saturate itself with similar oxygen levels to that of cold water, the transportation of oxygen in the deep ocean currents like the Labrador Current is severely reduced. This means that in habitats that are already characterised by a reduced amount of oxygen are experiencing increasingly intensified distress. Oxygen levels are now on the brink of crossing a threshold that will fail to be able to support life as it has existed in the past.
Present:
6.)
Jeffrey A. Hutchings, Isabelle M. Côté, Julian J. Dodson, Ian A. Fleming, S. Jennings, Nathan J. Mantua, Randall M. Peterman, Brian E. Riddell, and Andrew J. Weaver. "Climate Change, Fisheries, and Aquaculture: Trends and Consequences for Canadian Marine Biodiversity." Environmental Reviews 20, no. 4 (2012): 220-311. Accessed November 8, 2020. http://www.jstor.org/stable/envirevi.20.4.220
The intention of this article is to provide its reader with an in-depth understanding about the state of marine biodiversity along Canadian waters by providing a comparison with former conditions, and to provide projections on how anthropogenic climate change will impact marine species in the years to come. Much of the article focuses on fishing patterns, endangered species and trends in population stocks. When writing about climate conditions and climate change this article focused on how changing conditions will affect marine populations and diversity by analyzing specific patterns such as breeding, habitat and resource availability. When analyzing these various factors this article provided invaluable data for understanding just how big of an impact climate change has already had on Atlantic waters and how conditions are projected to become even more volatile. This article highlighted six important areas of change: ocean temperatures, wind patterns, vertical mixing, salinity levels, oxygen levels and acidity.
With regards to temperatures, this article explained that as the difference between high latitude and tropical temperatures decreases due to global warming, this phenomenon is projected to alter the track of tropical storms and allow for them to become directed on a more northern track. It also explained that the projection of high-latitude temperatures and precipitation will weaken the overturning and vertical mixing of nutrients within northern waters such as the Labrador Sea.
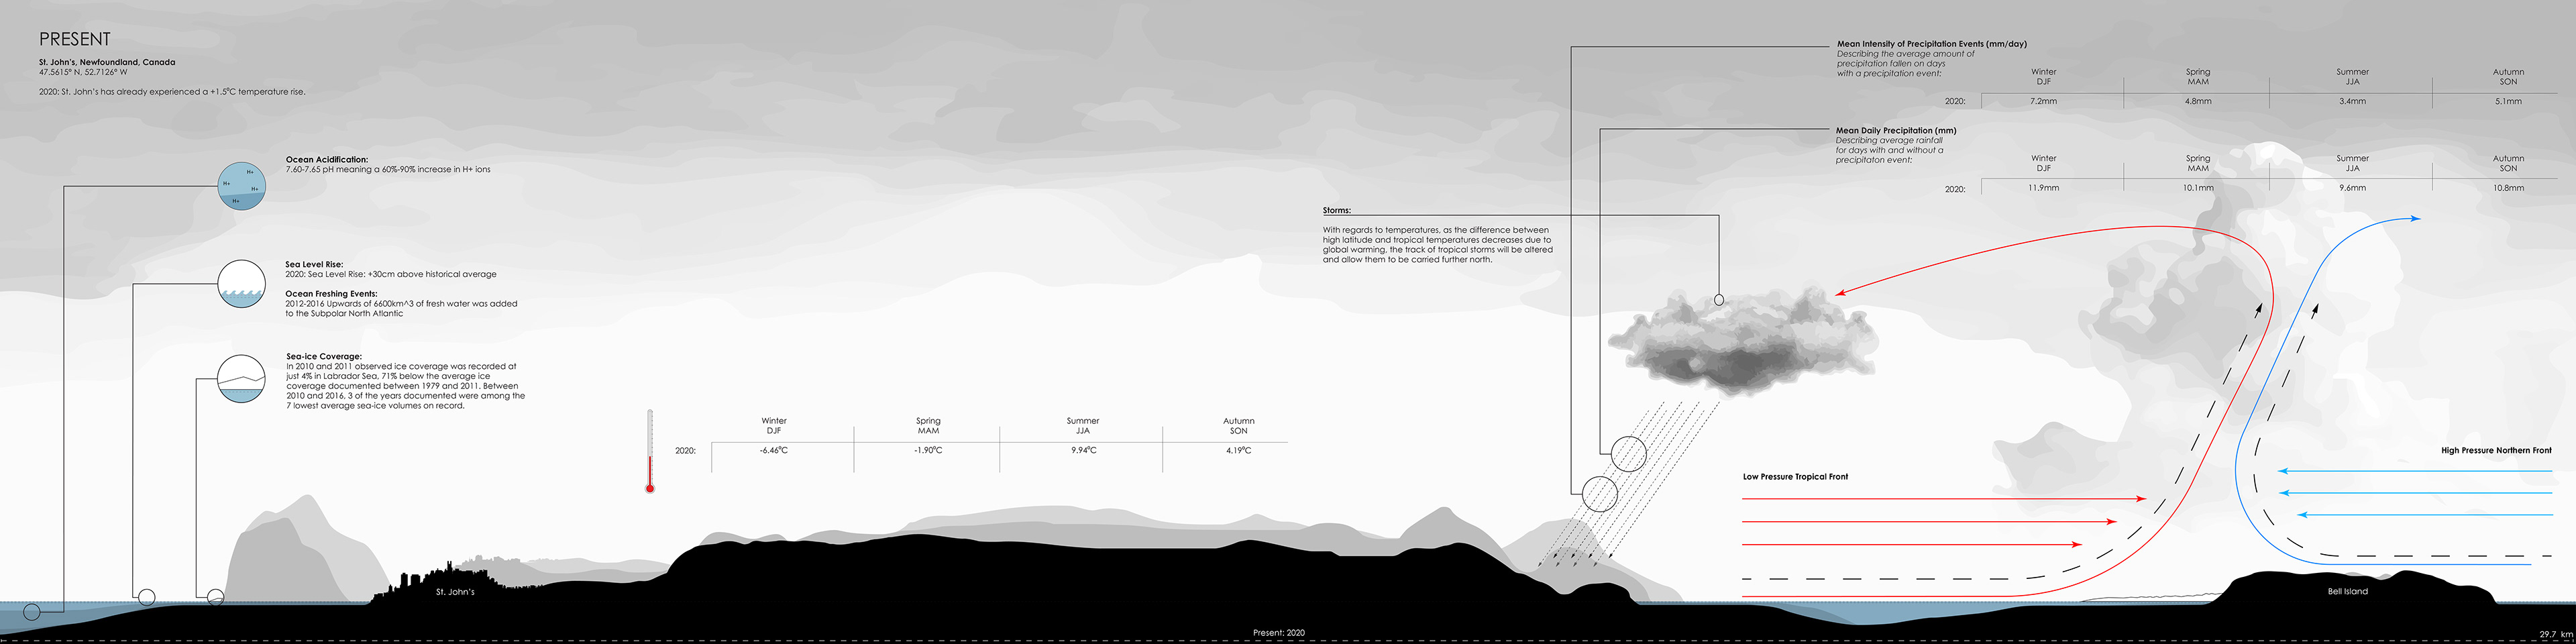
With regards to oxygen levels, this article made it apparent that dissolved oxygen levels are decreasing and this has resulted in hypoxic conditions that are a result of when dissolved oxygen levels are less than 2mg per litre. This article mentions how such a phenomenon has had a devastating impact off the coast of Oregon, causing mass losses in fish and crab populations that dwell along the bottom of the ocean, if Atlantic Canada follows its current trend it is likely to find itself facing a similar crisis. This article did not provide an overview of the hypoxic conditions in the immediate waters around St. Johns, however, it did explain that in the Gulf of St. Lawrence, based on the 7.90 pH level of hypoxic waters in the 1930s that were found in depths of greater than 200m, there has been a significant drop in pH levels. Current levels of the same area and depth have dropped down to a pH of between 7.65 to 7.60 representing a 60%-90% increase in H+ ions. This article explained that the increased levels of CO2 and Carbonic Acid (H2CO3) in the ocean have had a devastating impact on the internal organs of Atlantic Cod. It also made it evident that the Calcium needed by crustaceans and reef organisms to build their hard structures will be in such short supply and that because of this reef erosion will surpass reef construction by the middle of the century.
This Article also provided valuable insight into the retreat of sea ice, explaining that within the Labrador Sea, sea-ice coverage recorded in the years 2010 and 2011 was observed at only 4% coverage, 71% below the average ice-coverage that was documented between 1979 and 2011.
7.)
Holliday, N. Penny, Manfred Bersch, Barbara Berx, Léon Chafik, Stuart Cunningham, Cristian Florindo-López, Hjálmar Hátún, et al. “Ocean Circulation Causes the Largest Freshening Event for 120 Years in Eastern Subpolar North Atlantic,” January 29, 2020.
https://www.nature.com/articles/s41467-020-14474-y.
This article focuses its attention on the fluctuations of salinity in the subpolar North Atlantic (SPNA) and explains the defining role that salinity levels have on the transportation of heat and carbon into the SPNA. Caused by a warming global climate, fresh water runoff from melting glaciers have resulted in one of the strongest freshening events on record. The reading makes it clear the instruments needed for monitoring such an event are behind the necessary developmental stages required to have a full understanding of the sheer magnitude of this crisis, but the estimate is that between 2012-2016 upwards of 6600 km3 of freshwater was added to the upper 1000m of the SPNA. This has an enormous impact on the Atlantic Ocean Currents, resulting in more unstable weather and storm patterns. The changing currents are causing a trend of increasing positive wind stress curls along St. Johns and Atlantic Canada that will result in more pronounced coastal upwelling in the Grand Banks.
8.)
Bernier, R.Y., R.E. Jamieson, and A.M. Moore. Rep. State of the Atlantic Ocean Synthesis Report. Canada's Oceans Now, 2018.
https://waves-vagues.dfo-mpo.gc.ca/Library/40781987.pdf.
This report on the state of the Canadian Atlantic Ocean provided a breakdown of several key factors in regards to Climate Change: Sea Ice, Ocean Acidification, Sea Level Rise, and the state of the food chain producers of Phytoplankton and Eelgrass. In regards to Sea Ice, this report made it apparent that between 2010 and 2016, 3 of the years were among the 7 lowest average sea ice volumes on record; additionally, record high deep ocean temperatures have been observed along the South-Eastern tip of Newfoundland between 2012 and 2016. In regards to Ocean Acidification, this report explained that the acidity of ocean waters around the Newfoundland Shelf have been subjected to a decrease in pH levels of 0.02 units per decade since testing began in 1993. In regard to Sea Level Rise, this report described sea level rise as raising between 2 and 4 mm a year. St. Johns has experienced an increase of almost 30 cm since the early 1940s. In regards to phytoplankton, this report detailed a declining trend in nutrient and chlorophyll levels in the Canadian Atlantic along the Newfoundland and Labrador Shelves, and when compared to data collected from the Gulf of St. Lawrence and the Scotian Shelves, this area was the most heavily impacted. The spring phytoplankton bloom has followed an inconsistent but downward curve in its duration and phytoplankton biomasses have been far below average since 2015. In regards to Eelgrass, this report describes that because of rising ocean temperatures and reduced sea ice volumes within the Grand Banks the habitat for Eelgrass has been spreading.
9.)
“City Takes Action on Climate Change.” City Takes Action on Climate Change | City Of St. John's. Accessed November 12, 2020.
http://www.stjohns.ca/media-release/city-takes-action-climate-change
This page is a summary of the November 4th, 2019 City Council vote that declared Climate Mitigation and Adaptation as a Strategic Priority of the City of St. Johns. After describing the events of the vote, the page breaks down a series of evidence made by Natural Resources Canada and The United Nations International Panel on Climate Change that lead to a unanimous decision to vote in favor of the bill. The evidence that was put forward included: Atlantic Canada experiencing a warming of 0.7⁰C above historical averages, a significant increase in summer precipitation levels of 11.3%, while precipitation in the form of snow has followed a steady decline, an estimated sea level rise average of 1.9 mm a year, and finally the fact that the area is facing a .13⁰C temperature rise with each passing decade. The document then briefly explains how the City of St. Johns plans to respond to the above vulnerabilities.
Future:
10.)
Finnis, Joel, and Joseph Daraio. Rep. Projected Impacts of Climate Change for the Province of Newfoundland & Labrador: 2018 Update, May 29, 2018. https://www.turnbackthetide.ca/tools-and-resources/whatsnew/2018/Final_Report_2018.pdf
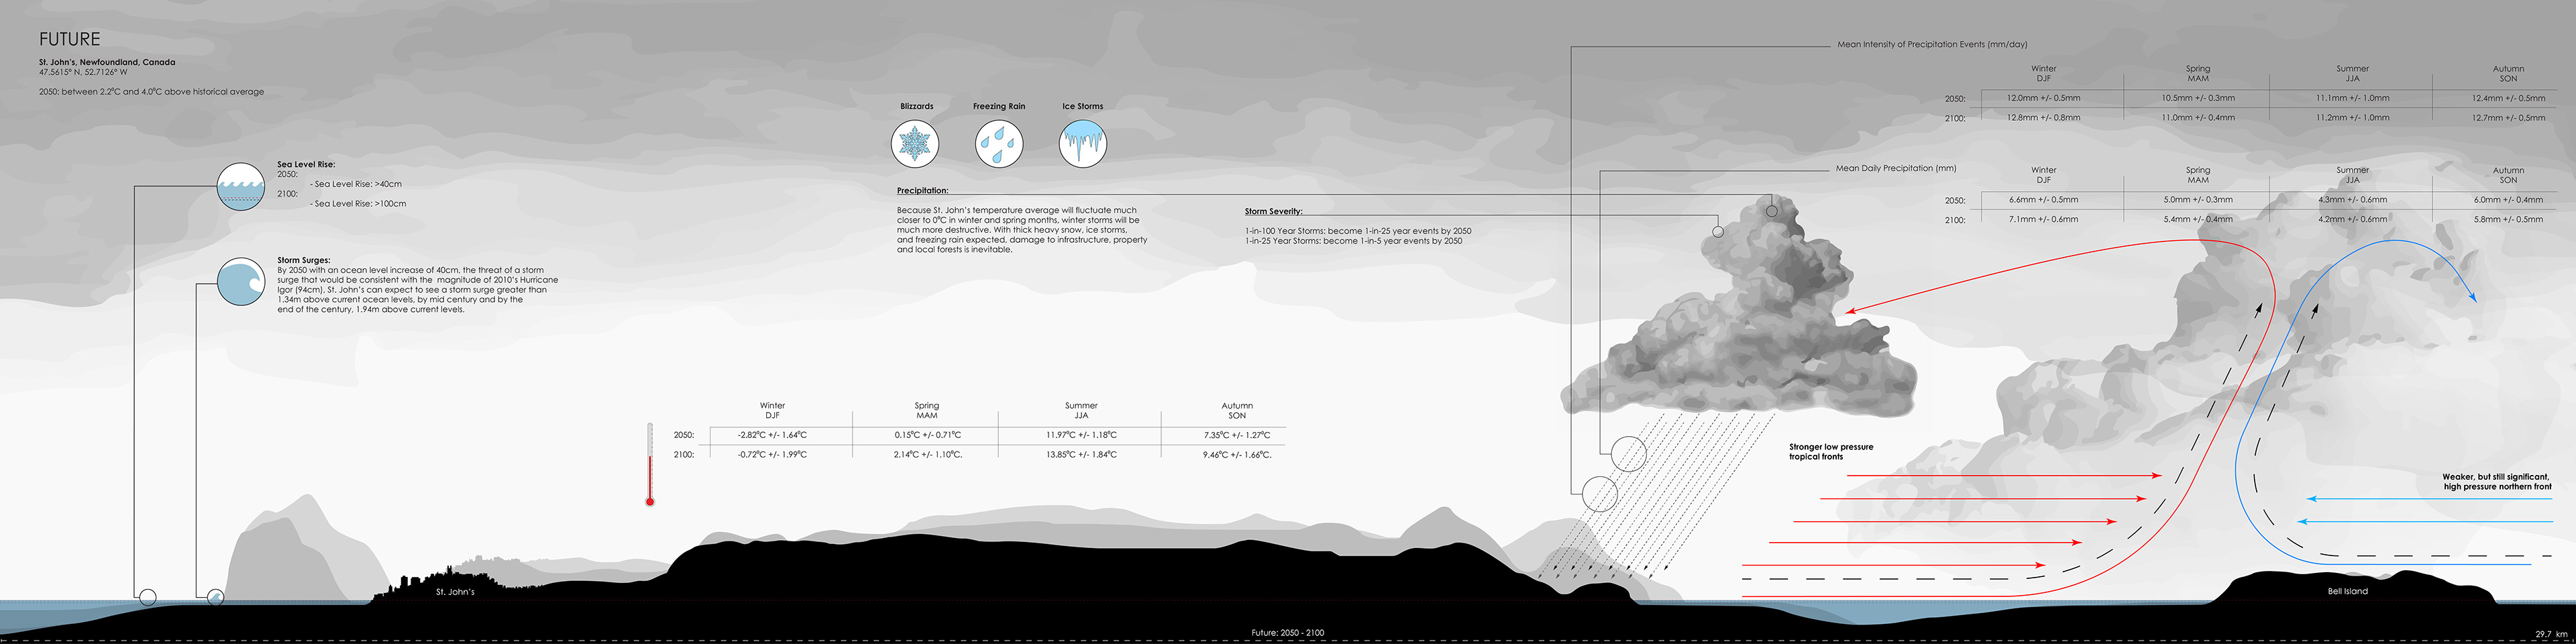
The focus of this report was the study of the increasing daily mean temperature in various regions of the province and the forecasted impact of climate change on provincial temperatures in the coming years. With regards to the daily mean temperature this report provided a breakdown of projections for the various regions of Newfoundland with regards to projections for the immediate future up until 2041, as well as projected temperatures for the mid century period of 2041-2070 and projections for the end of the century between 2071-2100. These periods were then further broken down into the winter, spring, summer and fall temperature averages. The winter period from now until 2041 will see a winter average of -6.46⁰C between December and February, this will change mid century to a winter average of -2.82⁰C with an uncertainty of 1.64⁰C, while the end of the century will see a winter average of -0.72⁰C with an uncertainty of 1.99⁰C. The spring period from now until 2041 will see an average temperature of -1.90⁰C between March and May, this will change mid century to a spring average of 0.15⁰C with an uncertainty of 0.71⁰C, while the end of the century will see a spring average of 2.14⁰C with an uncertainty of 1.10⁰C. The summer period from now until 2041 will see an average temperature of 9.94⁰C between June and August, this will change mid century to a summer average of 11.97⁰C with an uncertainty of 1.18⁰C, while the end of the century will see a summer average of 13.85⁰C with an uncertainty of 1.84⁰C. The fall period from now until 2041 will see an average temperature of 4.19⁰C between September and November, this will change mid century to a fall average of 7.35⁰C with an uncertainty of 1.27⁰C, while the end of the century will see a fall average of 9.46⁰C with an uncertainty of 1.66⁰C.
This report went into further analyses of the effects of climate change on St. Johns’ in regards to precipitation. This report explained that because the City’s yearly temperature average tends to fluctuate around 0⁰C, upward trends in temperature will result in less precipitation in the form of snow. However, this does not mean precipitation events will not continue to happen, because of an increase in humidity as a result of these rising temperatures, precipitation events are expected to stay relatively stable in terms of their frequency, but the amount of precipitation released in any given event is going to increase substantially. This means that in the winter and spring months, when temperatures are fluctuating around 0⁰C, severe snow storms and freezing rain events will become a more frequent occurrence and will become a serious challenge in regards to property damage and safety.
This report provided IDF Curves of St. Johns with the same projection periods of present levels, mid century levels and end of century levels as it did with daily mean temperatures. Provided with a graph indicating the length of rainfall, the amount of precipitation fallen, and the yearly return interval, this document made it evident that the city of St. Johns will be experiencing an increase across the board. The complex nature of this graph makes it difficult to condense into words but after calculating the changes St. John’s can expect to experience an increase in precipitation levels by a factor of roughly 1.18 by the mid century, and by a factor of roughly 1.26 by the end of the century.
11.)
https://www.gov.nl.ca/eccm/files/climate-data-pdf-idf-data-st-johns-airport-2018.pdf
This data set allowed for a comprehensive breakdown of Intensity-Duration Frequency (IDF) curves for the immediate area around St. John’s. The set provided an insight into the way in which storm intensity is projected to change in the coming years. What was most valuable about this chart was that it provided a data list for the norms and projected norms for three different periods within the century; the present norms for 2015-2020, the projected norms for the period between 2041-70, and the projected norms for 2071-2100. This made it evident that between now and the middle of the century, the effect of climate change on the characteristics of various types of storms is going to result in a significant increase in the amount of precipitation that storms release within the same time frame as past storms. By the end of the century, for instance, the amount of precipitation fallen during a short 5 minute precipitation event is projected to increase from 4.68mm to 6.06mm, this may seem relatively small but these small increases will no doubt amount to a very significant change in the climate, resulting in more fog, mist, and an increase in humidity. One of the most staggering projected statistics that these charts predicted is the increased severity of the devastating storms that only come a few times in a century. Precipitation levels expected to fall during these storm events is expected to increase by a factor of almost 1.33 across the board by the end of the century.
12.)
“Impacts of Climate Change.” Turn Back the Tide | Impacts of Climate Change. Accessed November 12, 2020.
https://www.turnbackthetide.ca/about-climate-change-and-energy-efficiency/impacts-of-climate-change.shtml
This document made by the Government of Newfoundland and Labrador outlines areas of concerns and vulnerabilities the province faces with regards to Climate Change and how these areas will impact the climate and ecosystems of the province. Specifically This document highlighted a series of projections that were based upon evidence that was recorded by the United States Environmental Protection Agency. The document makes it evident that the Province is already 1.5°C warmer than its historical average and projects that Newfoundland and Labrador will see an average annual temperature increase within the range of 2.2°C and 4.0°C by 2050. In addition to this the document projects that the Province could be facing a sea level rise of greater than 40cm by 2050 and as much as 100cm by the end of the century.
13.)
MacLean, C., Fairclough, I., & Johnson, K. (2019, April 05). Exploring the impact of climate change on Atlantic Canada's economy: The Chronicle Herald. Retrieved November 08, 2020, from
https://www.thechronicleherald.ca/in-depth/climate-crisis/exploring-the-impact-of-climate-change-on-atlantic-canadas-economy-298236/
This article provided an insight into how Atlantic Canada is fairing in regards to nationwide warming levels. Stating that the Canadian average increase since 1948 in the winter months is 3.3⁰C, spring has experienced 1.6⁰C of warming, summer has experienced 1.5⁰C of warming, and autumn has experienced 1.6⁰C of warming. By comparison in Atlantic Canada, is experiencing half the national levels. The article interviews David Philips, the chief climatologist for Environment and Climate Change Canada, who explains the reason behind this is caused because of the way our coastal seas trap and release heat in a manner that keeps the land comparatively warm to inland regions. He also explains that the global average for temperature increase over the last 130 years was matched by Atlantic Canada in 70, almost half the amount of time. The article concludes with the ominous notion that the most disastrous storms Atlantic Canada suffers, the monstrous storms that typically arrive once a century will likely increase in frequency and become a once in every twenty-five year phenomenon by the middle of the century. The storms that would normally arrive once every twenty five years have the potential to become as frequent as a one in every five year occurrence by the middle of the century.
14.)
Han, Guoqi, Zhimin Ma, Dake Chen, Brad deYoung, and Nancy Chen. “Observing Storm Surges from Space: Hurricane Igor off Newfoundland.” Nature News. Nature Publishing Group, December 20, 2012. https://www.nature.com/articles/srep01010.
This report emphasizes the growing concern of storm surges generated by tropical storms and their impact on the North-Eastern seaboard. By focusing its attention on Hurricane Igor of 2010, this report makes it apparent that St. John’s Newfoundland is positioned in a geographically vulnerable location in regards to an increasingly volatile tropical storm season. The storm surge generated by Hurricane Igor was so strong that through sheer wind force, it raised the ocean level within St. John’s harbour by 94cm on September 22nd, 2010. As the Atlantic hurricane season continues to intensify, storm surges of this magnitude are expected to become more common. When taking into account sea level rise, storm surges of this magnitude make St. John’s even more vulnerable. Based on data extracted from previous readings and by using the figure of 94cm as a base number for an extreme storm surge, I have extrapolated that by 2050 with an ocean level increase of 40cm and a storm surge of a similar magnitude to Hurricane Igor could produce a storm surge of 1.34 metres above current ocean levels, and by the end of the century 1.94 meters. This has the potential to be devastating for the St. John’s harbour and low lying areas of the East Coast.
15.)
Current Research (2015) Newfoundland and Labrador Department of Natural Resources Geological Survey, Report 15-1, pages 263-276 M.L. Irvine.
https://www.gov.nl.ca/iet/files/mines-geoscience-publications-currentresearch-2015-irvine-2015.pdf
The shorelines of Newfoundland tend to exist in the form of steep cliffs, St. John’s is fortunately located in a protected harbour that is shielded by these geographical barriers. However, the low lying areas of Newfoundland, places in relatively close proximity to St. John’s, such as Point Verde and Holyrood Pond are experiencing accelerated shoreline erosion. However, the beaches and coastal lowlands are not the only pieces of geography vulnerable to rising tides. This report makes it evident that the coastal cliffs and bluffs that line much of Newfoundland's shoreline are not as immune to the effects of sea level rise as previously expected. This report outlines these vulnerabilities as the following: more frequent and intensified storm surges; heavier winds resulting in cliff and sand erosion which in turn lead to overhanging turf mats; higher tides leading to the erosion of cliff bases that in turn will result in an over steepened and unstable cliff face; and finally with an increase in storm frequency, precipitation levels will amplify surface run-off that will lead to further erosion. The most valuable case study done within this report in regards to my research for St. Johns was the Chamberlain's coastline erosion study. Chamberlains is located just West of St. John’s on the west of the peninsula, its coastline follows a similar geography, the only difference that is important to distinguish is that wind levels and wave patterns are to an extent buffered by Bell Island. The data collection on the erosion rate of Chamberlain's coastline was collected between 2002 and 2014 which showed erosion levels ranging from 10.67 cm to 20.33 cm in various locations along the cliff face.
16.)
“Story Map Series.” gnl.maps.arcgis.com. Accessed November 10, 2020.
https://gnl.maps.arcgis.com/apps/MapSeries/index.html?appid=7e08dc1738204c92a5bff19d640ee760
This document was a further analysis of Newfoundland’s vulnerability to sea level rise. This document reaffirmed that St. Johns is positioned within a region that will face an average sea level rise expected to exceed 100cm by the end of the century, while the northern regions of the island of Newfoundland and lower parts of Labrador are expected to see a sea level rise between 70 and 100 cm. Most valuable about this article was the fact that it provided a lot of visuals that helped me further understand what climate change is going to look like in Newfoundland. Through photographic documentation, diagrams, illustrations, videos and maps, I found a wealth of knowledge from this source that really allowed for me to see the effects of various threats on the ground.
Past:
1.)
Hetzinger, S., J. Halfar, T. Zack, J. V. Mecking, B. E. Kunz, D. E. Jacob, and W. H. Adey. “Coralline Algal Barium as Indicator for 20th Century Northwestern North Atlantic Surface Ocean Freshwater Variability,” May 2, 2013.
https://www.nature.com/articles/srep01761
This report is the first multi-decadal record of annually resolved Ba/Ca variations in the Northwest Atlantic coralline algae, specifically along the Newfoundland coastline. This long term study documents how certain events, episode and elemental levels have changed over the latter half of the decade because of climate change, and demonstrates how Algal Ba/Ca ratios can serve as a vital resource in understanding and documenting fluctuations and trends in sea surface salinity and ocean freshwater. Large amounts of fresh water have been added to the North Atlantic as ice reserves in the North Pole and Greenland begin to melt. This report describes that this phenomenon is following a similar trend to the amplification of the North Atlantic Oscillation and increasing global temperatures, that have in turn resulted in an increased frequency of polar pulses. The effects of freshening events caused by polar pulses vary depending on the length and amount of water released. Within the Labrador Sea, freshening events decrease sea surface salinity levels and result in high levels of sea ice in the winter months. This report makes it evident that such changes have had a detrimental impact on the coastal waters around Newfoundland and Labrador, with a specific impact on the transportation of ice within the Labrador Current. A current that has historically provided a net cooling effect for both air and coastal water temperatures, is now seeing a warming trend.
2.)
Johnston, D. W., A. S. Friedlaender, L. G. Torres, and D. M. Lavigne. "Variation in Sea Ice Cover on the East Coast of Canada from 1969 to 2002: Climate Variability and Implications for Harp and Hooded Seals." Climate Research 29, no. 3 (2005): 209-22. Accessed November 3, 2020. http://www.jstor.org/stable/24868805.
https://www-jstor-org.myaccess.library.utoronto.ca/stable/24868805?seq=1#metadata_info_tab_contents
This article provided an analysis of the effects of climate change in regards to impacts on sea ice cover over the latter half of the 20th century by providing an in depth study on seal populations within Atlantic Canada. The reproductive success of pagophilic seals on sea ice is directly dependent, with less ice resulting in a smaller habitat which then has a detrimental impact on the mortality rate of seal pups. The article explains that the cause of this shrinkage in ice cover is directly related to the nature of positive pressure system trend within the North Atlantic Oscillation (NOA). The article makes it evident that the NOA is responsible for the climate of Atlantic Canada while also dictating the winters of the Eastern United States and much of Europe. With a roughly 30 year trend, between 1969 and 2002, leading the NOA into a cycle of more prominent positive pressure phases in winter months the results have led to warmer winters in the subtropics that generate stronger winter storms and push them on a north-westerly track directed towards the north-eastern United States and Atlantic Canada. The effects on St. Johns and Newfoundland are described as milder dry winters but with much more sporadic and destructive winter storms.
3.)
“St. John's Airport Weather Station Annual Climate Data.” Community Accounts: Climate Data. Accessed November 12, 2020. https://nl.communityaccounts.ca/climate/yearly_multi.asp?_=jYGUW1RPt6Z8lXlYVmidkGg_
This document served as an account for temperature and precipitation data for the 20th century. It synthesizes data from the Environment and Natural Resources Canada, with on site analytics collected from the St. John’s Airport. In regards to temperature the document made it apparent that annual temperatures have fluctuated greatly in the City since documentation began in 1942. St. John's hit high periods were the average annual temperature periods exceeded 5.0⁰C in the early 1950s and the late 1960s, after which the average temperatures dropped to a period that fluctuated around 4.5⁰C and as low as 4.14⁰C in both 1991 and 1993, but by 1997 temperatures once again surpassed the yearly average of 5.0⁰C and this time they have stayed above following on upwards trend. This report made it evident that annual totals in precipitation for the City have remained relatively stable, fluctuating around 1500mm with the occasional dry year that delivers between 1000mm and 1200mm of precipitation. The trend has followed a slight upwards trend since 1942, and since the 1980s the fluctuations in averages have become much more sporadic, but we are seeing a trend positioned in the 1500mm to 2000mm range.
4.)
Richter, Kristin, Jan Even Øie Nilsen, Roshin P. Raj, Ingo Bethke, Johnny A. Johannessen, Aimée B. A. Slangen, and Ben Marzeion. "Northern North Atlantic Sea Level in CMIP5 Climate Models: Evaluation of Mean State, Variability, and Trends against Altimetric Observations." Journal of Climate 30, no. 23 (2017): 9383-398. Accessed November 3, 2020. doi:10.2307/26388724.
https://www-jstor-org.myaccess.library.utoronto.ca/stable/26388724?Search=yes&resultItemClick=true&searchText=north+atlantic+sea+level+rise&searchUri=%2Faction%2FdoBasicSearch%3FQuery%3Dnorth%2Batlantic%2Bsea%2Blevel%2Brise&ab_segments=0%2Fbasic_search_solr_cloud%2Fcontrol&refreqid=fastly-default%3A45cfac616faeed6f3d17fe32ec90ba5b&seq=1#metadata_info_tab_contents
This data packed article provided an impact assessment on land-ice melting and trends in sea level rise over a 20 year period within the North Atlantic and Labrador Sea. It made it clear that the regional wide trend, in its current form, is seeing an average increase of 1.75 mm per year. Within the entirety of the North Atlantic, altimetry satellite studies between 1993 and 2012, indicate that the region of the Labrador Sea finds itself on the more aggressive end of the spectrum. The Labrador Sea is seeing observable change in sea level rise that is increasing at a rate that is exceeding 2mm a year. This article also focuses on the source of this rise, that being the melting of the polar ice caps, and trends in glacial ice melt. The rest of the article is then a series of data sets, acronyms, graphs and dense text that attempted to reduce a vast array of trends and phenomena into a single linear trend that could describe a sort of universal North Atlantic mean state in regards to sea level rise.
5.) Rep. Canada's State of the Oceans Report, 2012. Ottawa, Ontario: Communications Branch Fisheries and Oceans Canada, 2012.
https://www.dfo-mpo.gc.ca/oceans/publications/soto-rceo/2012/page03-eng.html
This report provided me with an in-depth understanding of the effects of hypoxic conditions and how warming currents are going to affect aquatic life throughout Canadian Oceans. Within the Atlantic region, hypoxia is well underway. In locations such as the Gulf of St. Lawrence, this page makes it evident that in deeper waters a significant reduction has been made to saturation levels since 1932 when levels were first recorded. In 1932, the recorded figure for oxygen saturation stood at a healthy 38%, by comparison, just some 50 years later, levels in the same location had been reduced to just 20% by the mid 1980s. The report explains that the main cause of this reduction is due to a temperature spike in deep water currents. As warm water is unable to saturate itself with similar oxygen levels to that of cold water, the transportation of oxygen in the deep ocean currents like the Labrador Current is severely reduced. This means that in habitats that are already characterised by a reduced amount of oxygen are experiencing increasingly intensified distress. Oxygen levels are now on the brink of crossing a threshold that will fail to be able to support life as it has existed in the past.
Present:
6.)
Jeffrey A. Hutchings, Isabelle M. Côté, Julian J. Dodson, Ian A. Fleming, S. Jennings, Nathan J. Mantua, Randall M. Peterman, Brian E. Riddell, and Andrew J. Weaver. "Climate Change, Fisheries, and Aquaculture: Trends and Consequences for Canadian Marine Biodiversity." Environmental Reviews 20, no. 4 (2012): 220-311. Accessed November 8, 2020. http://www.jstor.org/stable/envirevi.20.4.220
The intention of this article is to provide its reader with an in-depth understanding about the state of marine biodiversity along Canadian waters by providing a comparison with former conditions, and to provide projections on how anthropogenic climate change will impact marine species in the years to come. Much of the article focuses on fishing patterns, endangered species and trends in population stocks. When writing about climate conditions and climate change this article focused on how changing conditions will affect marine populations and diversity by analyzing specific patterns such as breeding, habitat and resource availability. When analyzing these various factors this article provided invaluable data for understanding just how big of an impact climate change has already had on Atlantic waters and how conditions are projected to become even more volatile. This article highlighted six important areas of change: ocean temperatures, wind patterns, vertical mixing, salinity levels, oxygen levels and acidity.
With regards to temperatures, this article explained that as the difference between high latitude and tropical temperatures decreases due to global warming, this phenomenon is projected to alter the track of tropical storms and allow for them to become directed on a more northern track. It also explained that the projection of high-latitude temperatures and precipitation will weaken the overturning and vertical mixing of nutrients within northern waters such as the Labrador Sea.
With regards to oxygen levels, this article made it apparent that dissolved oxygen levels are decreasing and this has resulted in hypoxic conditions that are a result of when dissolved oxygen levels are less than 2mg per litre. This article mentions how such a phenomenon has had a devastating impact off the coast of Oregon, causing mass losses in fish and crab populations that dwell along the bottom of the ocean, if Atlantic Canada follows its current trend it is likely to find itself facing a similar crisis. This article did not provide an overview of the hypoxic conditions in the immediate waters around St. Johns, however, it did explain that in the Gulf of St. Lawrence, based on the 7.90 pH level of hypoxic waters in the 1930s that were found in depths of greater than 200m, there has been a significant drop in pH levels. Current levels of the same area and depth have dropped down to a pH of between 7.65 to 7.60 representing a 60%-90% increase in H+ ions. This article explained that the increased levels of CO2 and Carbonic Acid (H2CO3) in the ocean have had a devastating impact on the internal organs of Atlantic Cod. It also made it evident that the Calcium needed by crustaceans and reef organisms to build their hard structures will be in such short supply and that because of this reef erosion will surpass reef construction by the middle of the century.
This Article also provided valuable insight into the retreat of sea ice, explaining that within the Labrador Sea, sea-ice coverage recorded in the years 2010 and 2011 was observed at only 4% coverage, 71% below the average ice-coverage that was documented between 1979 and 2011.
7.)
Holliday, N. Penny, Manfred Bersch, Barbara Berx, Léon Chafik, Stuart Cunningham, Cristian Florindo-López, Hjálmar Hátún, et al. “Ocean Circulation Causes the Largest Freshening Event for 120 Years in Eastern Subpolar North Atlantic,” January 29, 2020.
https://www.nature.com/articles/s41467-020-14474-y.
This article focuses its attention on the fluctuations of salinity in the subpolar North Atlantic (SPNA) and explains the defining role that salinity levels have on the transportation of heat and carbon into the SPNA. Caused by a warming global climate, fresh water runoff from melting glaciers have resulted in one of the strongest freshening events on record. The reading makes it clear the instruments needed for monitoring such an event are behind the necessary developmental stages required to have a full understanding of the sheer magnitude of this crisis, but the estimate is that between 2012-2016 upwards of 6600 km3 of freshwater was added to the upper 1000m of the SPNA. This has an enormous impact on the Atlantic Ocean Currents, resulting in more unstable weather and storm patterns. The changing currents are causing a trend of increasing positive wind stress curls along St. Johns and Atlantic Canada that will result in more pronounced coastal upwelling in the Grand Banks.
8.)
Bernier, R.Y., R.E. Jamieson, and A.M. Moore. Rep. State of the Atlantic Ocean Synthesis Report. Canada's Oceans Now, 2018.
https://waves-vagues.dfo-mpo.gc.ca/Library/40781987.pdf.
This report on the state of the Canadian Atlantic Ocean provided a breakdown of several key factors in regards to Climate Change: Sea Ice, Ocean Acidification, Sea Level Rise, and the state of the food chain producers of Phytoplankton and Eelgrass. In regards to Sea Ice, this report made it apparent that between 2010 and 2016, 3 of the years were among the 7 lowest average sea ice volumes on record; additionally, record high deep ocean temperatures have been observed along the South-Eastern tip of Newfoundland between 2012 and 2016. In regards to Ocean Acidification, this report explained that the acidity of ocean waters around the Newfoundland Shelf have been subjected to a decrease in pH levels of 0.02 units per decade since testing began in 1993. In regard to Sea Level Rise, this report described sea level rise as raising between 2 and 4 mm a year. St. Johns has experienced an increase of almost 30 cm since the early 1940s. In regards to phytoplankton, this report detailed a declining trend in nutrient and chlorophyll levels in the Canadian Atlantic along the Newfoundland and Labrador Shelves, and when compared to data collected from the Gulf of St. Lawrence and the Scotian Shelves, this area was the most heavily impacted. The spring phytoplankton bloom has followed an inconsistent but downward curve in its duration and phytoplankton biomasses have been far below average since 2015. In regards to Eelgrass, this report describes that because of rising ocean temperatures and reduced sea ice volumes within the Grand Banks the habitat for Eelgrass has been spreading.
9.)
“City Takes Action on Climate Change.” City Takes Action on Climate Change | City Of St. John's. Accessed November 12, 2020.
http://www.stjohns.ca/media-release/city-takes-action-climate-change
This page is a summary of the November 4th, 2019 City Council vote that declared Climate Mitigation and Adaptation as a Strategic Priority of the City of St. Johns. After describing the events of the vote, the page breaks down a series of evidence made by Natural Resources Canada and The United Nations International Panel on Climate Change that lead to a unanimous decision to vote in favor of the bill. The evidence that was put forward included: Atlantic Canada experiencing a warming of 0.7⁰C above historical averages, a significant increase in summer precipitation levels of 11.3%, while precipitation in the form of snow has followed a steady decline, an estimated sea level rise average of 1.9 mm a year, and finally the fact that the area is facing a .13⁰C temperature rise with each passing decade. The document then briefly explains how the City of St. Johns plans to respond to the above vulnerabilities.
Future:
10.)
Finnis, Joel, and Joseph Daraio. Rep. Projected Impacts of Climate Change for the Province of Newfoundland & Labrador: 2018 Update, May 29, 2018. https://www.turnbackthetide.ca/tools-and-resources/whatsnew/2018/Final_Report_2018.pdf
The focus of this report was the study of the increasing daily mean temperature in various regions of the province and the forecasted impact of climate change on provincial temperatures in the coming years. With regards to the daily mean temperature this report provided a breakdown of projections for the various regions of Newfoundland with regards to projections for the immediate future up until 2041, as well as projected temperatures for the mid century period of 2041-2070 and projections for the end of the century between 2071-2100. These periods were then further broken down into the winter, spring, summer and fall temperature averages. The winter period from now until 2041 will see a winter average of -6.46⁰C between December and February, this will change mid century to a winter average of -2.82⁰C with an uncertainty of 1.64⁰C, while the end of the century will see a winter average of -0.72⁰C with an uncertainty of 1.99⁰C. The spring period from now until 2041 will see an average temperature of -1.90⁰C between March and May, this will change mid century to a spring average of 0.15⁰C with an uncertainty of 0.71⁰C, while the end of the century will see a spring average of 2.14⁰C with an uncertainty of 1.10⁰C. The summer period from now until 2041 will see an average temperature of 9.94⁰C between June and August, this will change mid century to a summer average of 11.97⁰C with an uncertainty of 1.18⁰C, while the end of the century will see a summer average of 13.85⁰C with an uncertainty of 1.84⁰C. The fall period from now until 2041 will see an average temperature of 4.19⁰C between September and November, this will change mid century to a fall average of 7.35⁰C with an uncertainty of 1.27⁰C, while the end of the century will see a fall average of 9.46⁰C with an uncertainty of 1.66⁰C.
This report went into further analyses of the effects of climate change on St. Johns’ in regards to precipitation. This report explained that because the City’s yearly temperature average tends to fluctuate around 0⁰C, upward trends in temperature will result in less precipitation in the form of snow. However, this does not mean precipitation events will not continue to happen, because of an increase in humidity as a result of these rising temperatures, precipitation events are expected to stay relatively stable in terms of their frequency, but the amount of precipitation released in any given event is going to increase substantially. This means that in the winter and spring months, when temperatures are fluctuating around 0⁰C, severe snow storms and freezing rain events will become a more frequent occurrence and will become a serious challenge in regards to property damage and safety.
This report provided IDF Curves of St. Johns with the same projection periods of present levels, mid century levels and end of century levels as it did with daily mean temperatures. Provided with a graph indicating the length of rainfall, the amount of precipitation fallen, and the yearly return interval, this document made it evident that the city of St. Johns will be experiencing an increase across the board. The complex nature of this graph makes it difficult to condense into words but after calculating the changes St. John’s can expect to experience an increase in precipitation levels by a factor of roughly 1.18 by the mid century, and by a factor of roughly 1.26 by the end of the century.
11.)
https://www.gov.nl.ca/eccm/files/climate-data-pdf-idf-data-st-johns-airport-2018.pdf
This data set allowed for a comprehensive breakdown of Intensity-Duration Frequency (IDF) curves for the immediate area around St. John’s. The set provided an insight into the way in which storm intensity is projected to change in the coming years. What was most valuable about this chart was that it provided a data list for the norms and projected norms for three different periods within the century; the present norms for 2015-2020, the projected norms for the period between 2041-70, and the projected norms for 2071-2100. This made it evident that between now and the middle of the century, the effect of climate change on the characteristics of various types of storms is going to result in a significant increase in the amount of precipitation that storms release within the same time frame as past storms. By the end of the century, for instance, the amount of precipitation fallen during a short 5 minute precipitation event is projected to increase from 4.68mm to 6.06mm, this may seem relatively small but these small increases will no doubt amount to a very significant change in the climate, resulting in more fog, mist, and an increase in humidity. One of the most staggering projected statistics that these charts predicted is the increased severity of the devastating storms that only come a few times in a century. Precipitation levels expected to fall during these storm events is expected to increase by a factor of almost 1.33 across the board by the end of the century.
12.)
“Impacts of Climate Change.” Turn Back the Tide | Impacts of Climate Change. Accessed November 12, 2020.
https://www.turnbackthetide.ca/about-climate-change-and-energy-efficiency/impacts-of-climate-change.shtml
This document made by the Government of Newfoundland and Labrador outlines areas of concerns and vulnerabilities the province faces with regards to Climate Change and how these areas will impact the climate and ecosystems of the province. Specifically This document highlighted a series of projections that were based upon evidence that was recorded by the United States Environmental Protection Agency. The document makes it evident that the Province is already 1.5°C warmer than its historical average and projects that Newfoundland and Labrador will see an average annual temperature increase within the range of 2.2°C and 4.0°C by 2050. In addition to this the document projects that the Province could be facing a sea level rise of greater than 40cm by 2050 and as much as 100cm by the end of the century.
13.)
MacLean, C., Fairclough, I., & Johnson, K. (2019, April 05). Exploring the impact of climate change on Atlantic Canada's economy: The Chronicle Herald. Retrieved November 08, 2020, from
https://www.thechronicleherald.ca/in-depth/climate-crisis/exploring-the-impact-of-climate-change-on-atlantic-canadas-economy-298236/
This article provided an insight into how Atlantic Canada is fairing in regards to nationwide warming levels. Stating that the Canadian average increase since 1948 in the winter months is 3.3⁰C, spring has experienced 1.6⁰C of warming, summer has experienced 1.5⁰C of warming, and autumn has experienced 1.6⁰C of warming. By comparison in Atlantic Canada, is experiencing half the national levels. The article interviews David Philips, the chief climatologist for Environment and Climate Change Canada, who explains the reason behind this is caused because of the way our coastal seas trap and release heat in a manner that keeps the land comparatively warm to inland regions. He also explains that the global average for temperature increase over the last 130 years was matched by Atlantic Canada in 70, almost half the amount of time. The article concludes with the ominous notion that the most disastrous storms Atlantic Canada suffers, the monstrous storms that typically arrive once a century will likely increase in frequency and become a once in every twenty-five year phenomenon by the middle of the century. The storms that would normally arrive once every twenty five years have the potential to become as frequent as a one in every five year occurrence by the middle of the century.
14.)
Han, Guoqi, Zhimin Ma, Dake Chen, Brad deYoung, and Nancy Chen. “Observing Storm Surges from Space: Hurricane Igor off Newfoundland.” Nature News. Nature Publishing Group, December 20, 2012. https://www.nature.com/articles/srep01010.
This report emphasizes the growing concern of storm surges generated by tropical storms and their impact on the North-Eastern seaboard. By focusing its attention on Hurricane Igor of 2010, this report makes it apparent that St. John’s Newfoundland is positioned in a geographically vulnerable location in regards to an increasingly volatile tropical storm season. The storm surge generated by Hurricane Igor was so strong that through sheer wind force, it raised the ocean level within St. John’s harbour by 94cm on September 22nd, 2010. As the Atlantic hurricane season continues to intensify, storm surges of this magnitude are expected to become more common. When taking into account sea level rise, storm surges of this magnitude make St. John’s even more vulnerable. Based on data extracted from previous readings and by using the figure of 94cm as a base number for an extreme storm surge, I have extrapolated that by 2050 with an ocean level increase of 40cm and a storm surge of a similar magnitude to Hurricane Igor could produce a storm surge of 1.34 metres above current ocean levels, and by the end of the century 1.94 meters. This has the potential to be devastating for the St. John’s harbour and low lying areas of the East Coast.
15.)
Current Research (2015) Newfoundland and Labrador Department of Natural Resources Geological Survey, Report 15-1, pages 263-276 M.L. Irvine.
https://www.gov.nl.ca/iet/files/mines-geoscience-publications-currentresearch-2015-irvine-2015.pdf
The shorelines of Newfoundland tend to exist in the form of steep cliffs, St. John’s is fortunately located in a protected harbour that is shielded by these geographical barriers. However, the low lying areas of Newfoundland, places in relatively close proximity to St. John’s, such as Point Verde and Holyrood Pond are experiencing accelerated shoreline erosion. However, the beaches and coastal lowlands are not the only pieces of geography vulnerable to rising tides. This report makes it evident that the coastal cliffs and bluffs that line much of Newfoundland's shoreline are not as immune to the effects of sea level rise as previously expected. This report outlines these vulnerabilities as the following: more frequent and intensified storm surges; heavier winds resulting in cliff and sand erosion which in turn lead to overhanging turf mats; higher tides leading to the erosion of cliff bases that in turn will result in an over steepened and unstable cliff face; and finally with an increase in storm frequency, precipitation levels will amplify surface run-off that will lead to further erosion. The most valuable case study done within this report in regards to my research for St. Johns was the Chamberlain's coastline erosion study. Chamberlains is located just West of St. John’s on the west of the peninsula, its coastline follows a similar geography, the only difference that is important to distinguish is that wind levels and wave patterns are to an extent buffered by Bell Island. The data collection on the erosion rate of Chamberlain's coastline was collected between 2002 and 2014 which showed erosion levels ranging from 10.67 cm to 20.33 cm in various locations along the cliff face.
16.)
“Story Map Series.” gnl.maps.arcgis.com. Accessed November 10, 2020.
https://gnl.maps.arcgis.com/apps/MapSeries/index.html?appid=7e08dc1738204c92a5bff19d640ee760
This document was a further analysis of Newfoundland’s vulnerability to sea level rise. This document reaffirmed that St. Johns is positioned within a region that will face an average sea level rise expected to exceed 100cm by the end of the century, while the northern regions of the island of Newfoundland and lower parts of Labrador are expected to see a sea level rise between 70 and 100 cm. Most valuable about this article was the fact that it provided a lot of visuals that helped me further understand what climate change is going to look like in Newfoundland. Through photographic documentation, diagrams, illustrations, videos and maps, I found a wealth of knowledge from this source that really allowed for me to see the effects of various threats on the ground.